Ecological Applications of GIS: A brief review of the GIS in the Rockies Conference

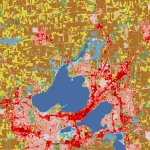
Source: http://www.mrlc.gov/nlcd.php
One of the primary tenets of spatial ecology is that ecological processes occur in a spatial context and are constrained by location.
Understanding how space and scale relate to ecological processes has become a major area of research and it is now commonplace in the ecological literature to discuss processes in a spatially explicit manner.
The last couple of decades have seen immense developments in spatial analysis, both in the field of ecology and beyond, and geographic information systems (GIS) have emerged as a primary analytical tool for many ecologists, myself included. This week I ventured to the annual GIS in the Rockies conference in Denver to check out the new developments in the field and hopefully gather a few new tools to apply in an ecological fashion. Here are a few highlights of work in the natural sciences from the conference, presented with abstracts.
First, a summary of the NREL and CSU presence at the conference:
Wildfire and Wetlands: Mapping with LANDSAT, GIS, and Statistical Models – Stephen Chignell (ESS) and Sky Skach (ESS/GDPE)

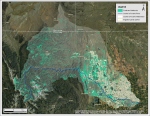
Utilizing LANDSAT imagery, GIS layers, and boosted regression trees modeling, the NASA DEVELOP team based at the North Central Climate Science Center at Colorado State University conducted an investigation into riparian, wetland and headwaters modeling within the Cache la Poudre watershed. These efforts produced a preliminary model of predicted wetlands across the watershed, which is currently being refined by field data collection and modeling within three elevation-based “life zones.”
The ultimate goal of this ongoing project is to provide important spatial data for land managers and create a riparian and wetlands modeling methodology that can be reproduced throughout the intermountain west region.
Geospatial Modeling of Mountain Pine Beetle Mortality – Aaron Sidder (ESS/GDPE)

Mountain pine beetle (Dendroctonus ponderosae) has infested 3.4 million acres of forest in Colorado since 1996 and continues to spread throughout the forests of western North America. This project identified the severity and extent of lodgepole pine (Pinus contorta) tree mortality at Fraser Experimental Forest (FEF). We mapped the spatial extent and severity of the outbreak using the Software for Assisted Habitat Modeling (SAHM) and a boosted regression tree model. The model combined satellite imagery from the Landsat 5 TM sensor, a variety of spectral vegetation indices, differenced satellite images (pre- and post-infestation), and field data collected at FEF. The results yielded a continuous mortality map showing the ratio of dead lodgepole pine to the basal area of all trees. The model accuracy was tested in R and had a cross validation (CV) correlation of 0.782 and an adjusted r-squared of 0.8072. The methodology from this project can be scaled up to assess mountain pine beetle impacts at a regional level. Results from this study will be used to enhance forest management efforts in mitigating hazards from standing dead trees and will provide a foundation for further research into the impacts of mountain pine beetle on wildlife habitat, hydrology, and recreation.
Estuarine Habitat Modeling in Southeast Alaska – Jamie Fuller (GDPE), Sam Litschert, and Carolyn Ownby
Estuarine habitats in Southeast Alaska include an extensive network of intertidal mudflats and salt marshes. Estuarine habitats are ecologically and economically important and provide critical habitat for diverse flora and fauna, protect shorelines from erosion and flooding, support recreation and commercial fisheries, and sequester large amounts of carbon. The extent of estuarine habitats in Southeast Alaska has not been accurately assessed because many areas are geographically isolated and large tidal oscillations deter access.

Here, our objective is to identify estuarine habitat using geomorphic variables, tidal prediction data, and remotely sensed data. Intertidal mudflats and salt marshes were delineated using annual tidal prediction data and the percentage of inundation per year using these methods in Puget Sound, WA. The best available bathymetric data for the whole of Southeast Alaska is 60 m, whereas Landsat imagery maintains finer spatial resolution at 30 m. Landsat images at low tide were used to detect estuarine habitat and validate the inundation model through randomly generated points. Estuarine ecosystems are fragile and to understand how natural and anthropogenic change may influence these systems over time, baseline data in remote areas, such as southeast Alaska are vital.
Developing an ArcGIS Toolbox for Estimating EvapoTranspiration of Vegetation using Remote Sensing Approach (Automation of Surface Energy Balance Model {ReSET]) – Aymn Elhaddad (Integrated Decision Support Group, Water Center, CSU)
Estimating water used by vegetated areas is very important for water resources management and water rights. Traditionally the amount of water delivered to an area is calculated by installing some measuring device (flumes, weirs, flow meters, etc.). The alternative approach presented here estimates the actual water use in a vegetated areas based on ground surface energy balance concept using the ReSET model (Remote Sensing of ET – ReSET developed by IDS group in Colorado State University) that uses satellite and aerial imagery with visible and thermal bands along with weather data to estimate daily actual crop Evapotranspiration (ET) for vegetated areas. Surface energy balance models have been proven to be a robust approach for estimating vegetation evapotranspiration. One of the main limitations of wider application of these models in water resources and irrigation management is the requirement of extensive back ground in surface energy modeling. This presentation shows the development and the application of an ArcGIS toolbox that runs an automated version of the ReSET model. The tool is compatible with NASA /USGS Landsat Legacy Project. The presented ArcGIS tool automates the model in all stages and requires minimum interference from user. The tool presented accommodates both basic and advanced users. The results using the tool were tested and validated using results from manual ReSET model runs.
Here are a couple highlights from other presenters at the conference related to ecological analysis:
Monitoring Ponderosa Pine Health Using Satellite Imagery – Kathleen Johnson (Digital Globe)
In recent years, forested areas along the foothills of the Colorado Front Range have been subject to parasite infestations and drought conditions that have stressed these systems. The focus of this study are the Ponderosa Pines (Pinus ponderosa) of the Jefferson County Parks and Open Space, which show the accumulated effects of infestation by Dwarf Mistletoe (Arceuthobium vaginatum cryptopodum), Mountain Pine Beetle (Dendroctonus ponderosae), and drought conditions that began in the Fall of 2011. Numerous studies have demonstrated the effectiveness of satellite imagery analysis for the monitoring of parasite infestations and general forest health. We have examined WorldView – 2 satellite imagery from 2010 – 2013, confirmed by ground truth provided by Jefferson County Parks and Open Space for White Ranch Park and Elk Meadow Park. The research approach included the examination of data optimization methods for spectral identification of affected trees using 8 – band data (e.g., normalized band ratios, principal component analysis, maximum noise fraction, and statistical validation), decision tree land cover classification methods, and change detection. The results of supervised classification analysis of Ponderosa Pine health have an accuracy of > 90% and a precision of 0.89 (Kappa Statistic). High accuracy land cover mapping is critical for parasite mitigation, and efforts to minimize future infestations. This project is part of an ongoing a partnership between Jefferson County Parks and Open Space and DigitalGlobe, monitoring vegetation health, invasive species and parasite activity for the purpose of long-range remediation planning.
Habitat Suitability Modeling of Texas Horned Lizard (Phrynosoma cornutum) at the Local Scale – Rachel Granberg (Texas Tech University)
The Texas horned lizard (THL; Phrynosoma cornutum) is a federally listed Species of Concern with population declines attributed to habitat loss, red-imported fire ant (Solenopsis invicta) invasion, and pesticide use. This project aims to elucidate the relationship between the currently declining THL, available habitat, and land management activities of central Texas. We created a habitat suitability model at the local scale using field data, expert knowledge of the species, and a multi-criteria GIS model. Radio telemetry of THL individuals and habitat surveys form the basis for the field data. Factors used to determine habitat suitability include harvester ant densities, vegetation structure, topographic variables, soil type, and land cover. The model also analyzes the effect prescribed fire and mechanical thinning may have on THL abundance and distribution. This model has the potential to vastly improve the success of THL reintroduction efforts and maximize efficiency of habitat restoration efforts.